Simulation Performance#
General Simulation Performance Hints
Solver Settings#
Lowering solver iterations to a count that still results in acceptable simulation fidelity will help a lot with performance. You can set global iteration clamps in the scene.
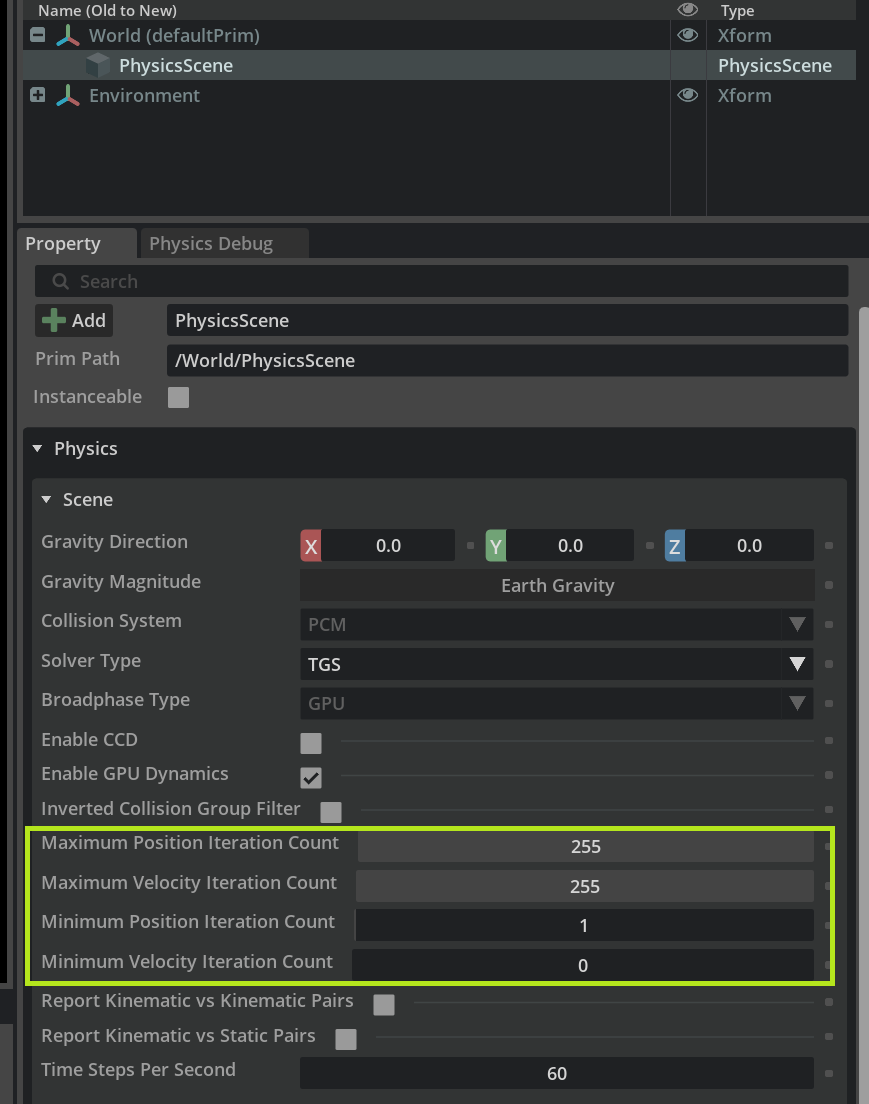
At equal iteration counts, PGS is typically faster than TGS, but one can often achieve lower iteration counts with TGS which will again be faster.
CPU and GPU Simulation Depending on Scene Size#
If you are simulating only a few rigid bodies and articulations, it is likely beneficial to switch to CPU simulation.
If you are simulating large scenes, for example in an RL setting, you should use the GPU simulation and access simulation state using a batch API, e.g. an articulation view.
Render Transforms in Runtime Fabric#
It is expensive to write back render transforms and other simulation state to USD and you should use the physics Fabric extension instead (see PhysX Flatcache (also known as Fabric)).
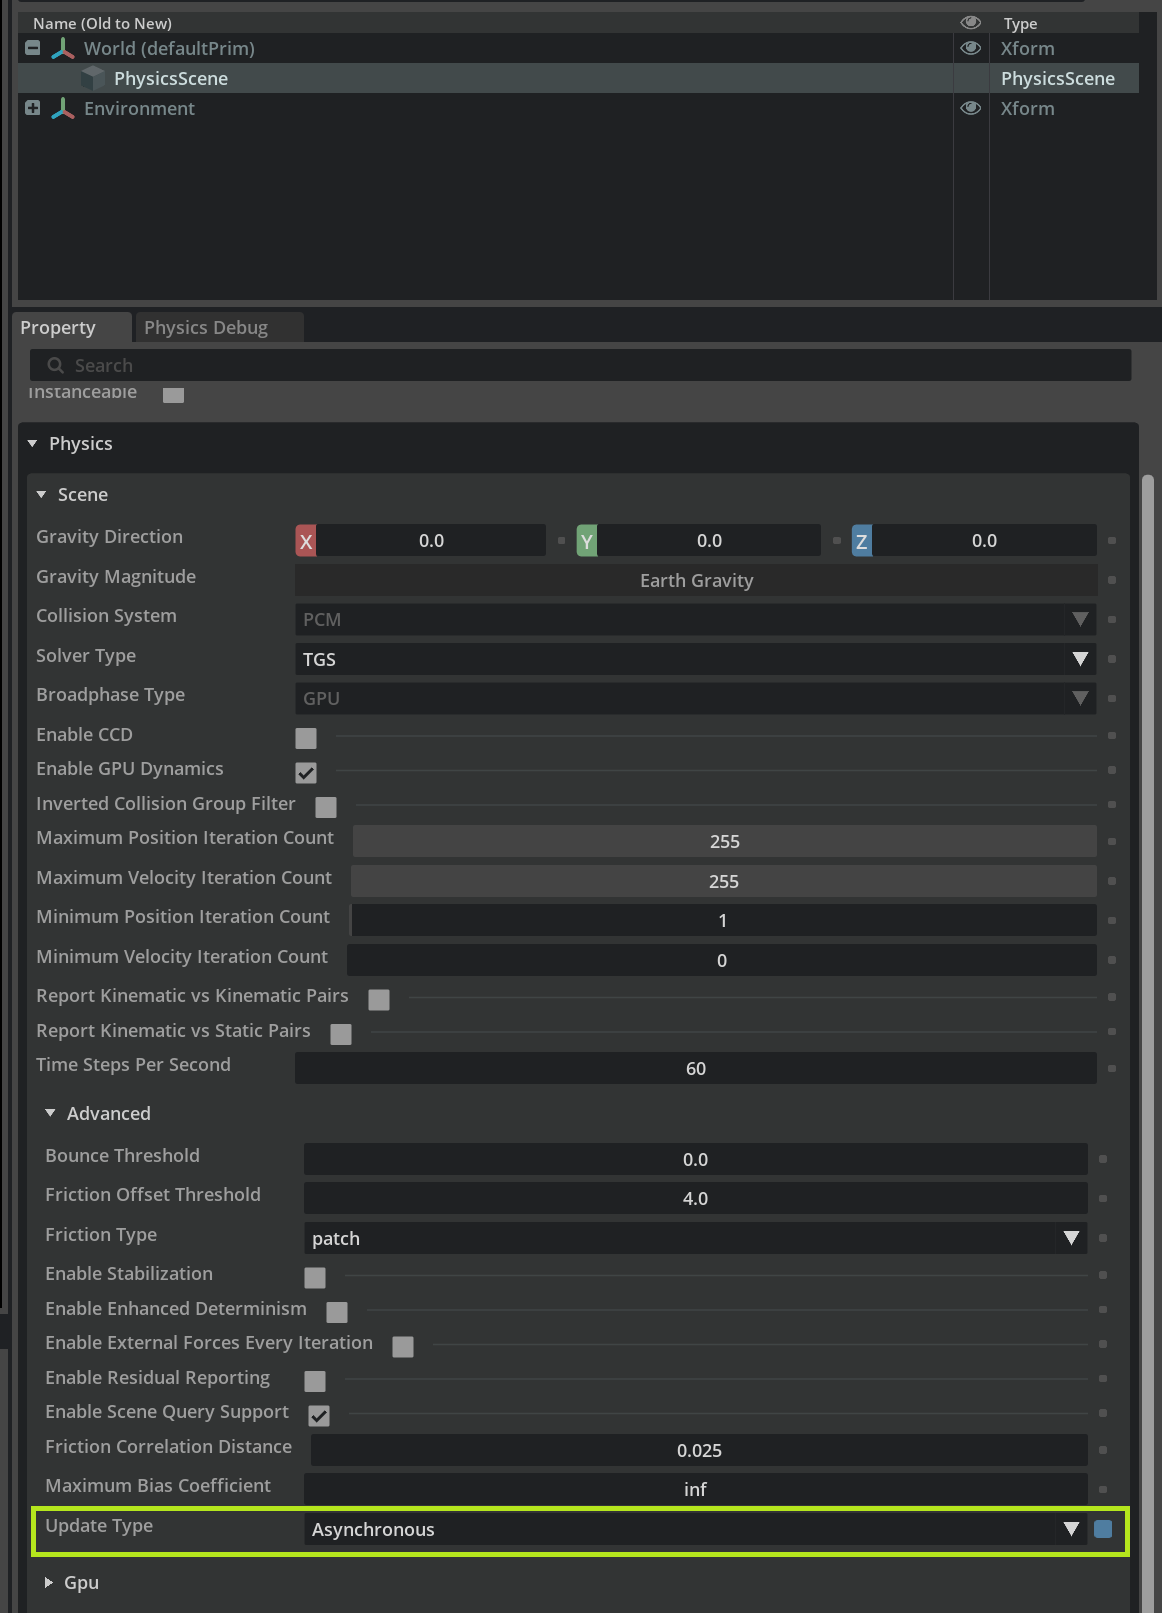
Asynchronous Simulation and Rendering#
In the scene settings, you can try the async update setting to run simulation and rendering in parallel.
This is ideal for simulations that do not need to run custom Python code every step, since Python can have issues when it is called from a separate thread.
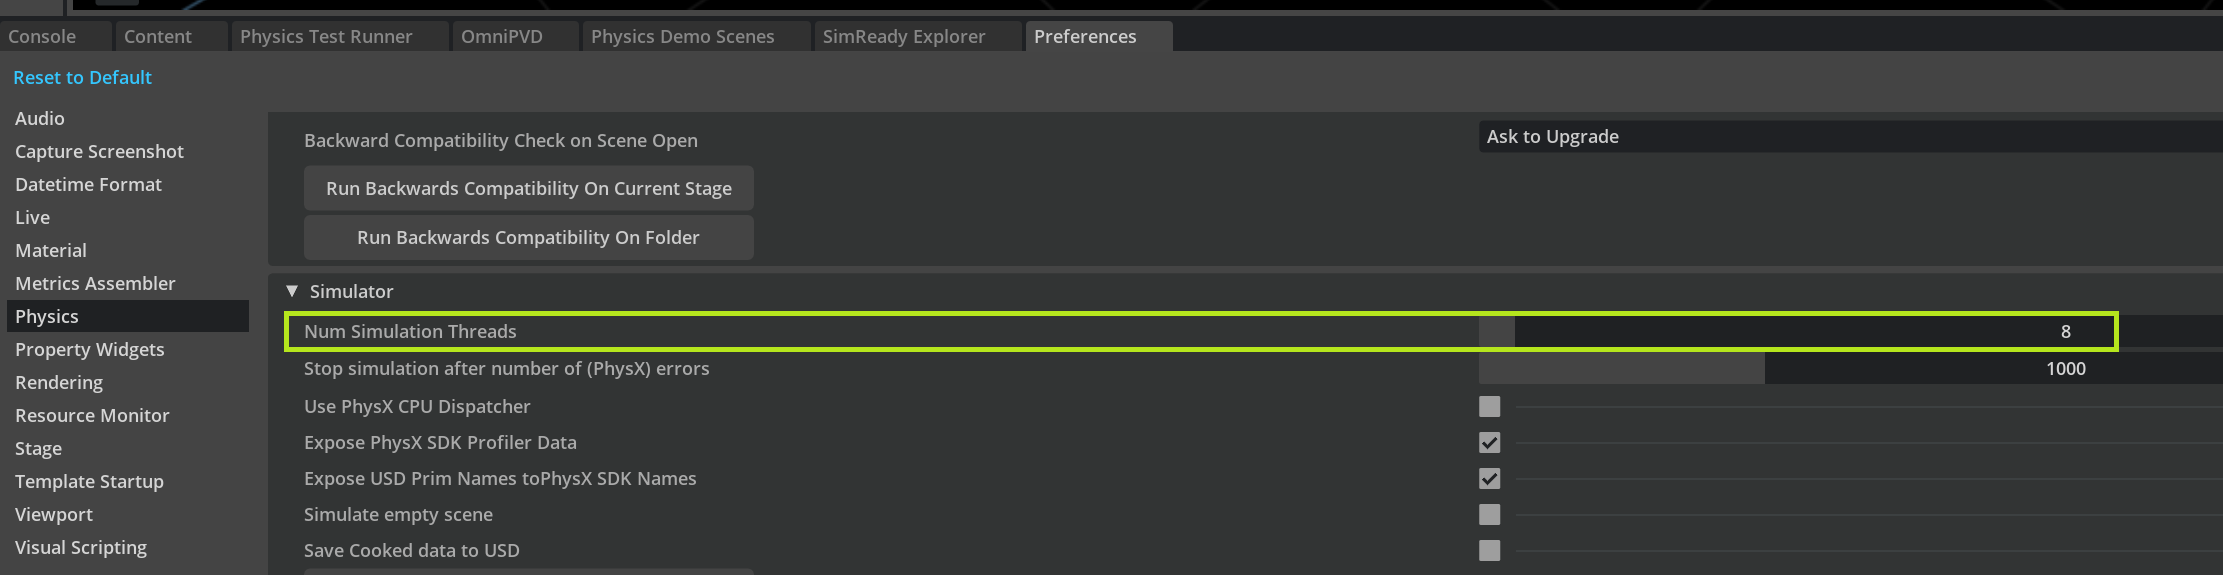
Physics Thread Count#
You may adjust the number of CPU threads used for simulation. We have seen cases where lower thread counts result in a speedup.
This can be changed in the Preferences tab, Physics section. Using 0 here runs the simulation single-threaded, which usually gives the best performance for small scenes.
Unintended Collision Geometry Overlap#
When setting up reinforcement learning simulation scenes with many parallel environments, make sure that you do not duplicate collision geometry such as ground planes that will generate a lot of inter-environment overlaps that are expensive to check in the collision phase.
Below is an example of an incorrectly setup scene, where the ground plane in the environment has been duplicated many times. Since a ground plane is infinite, each one touches all the environments, leading to performance and memory usage problems.
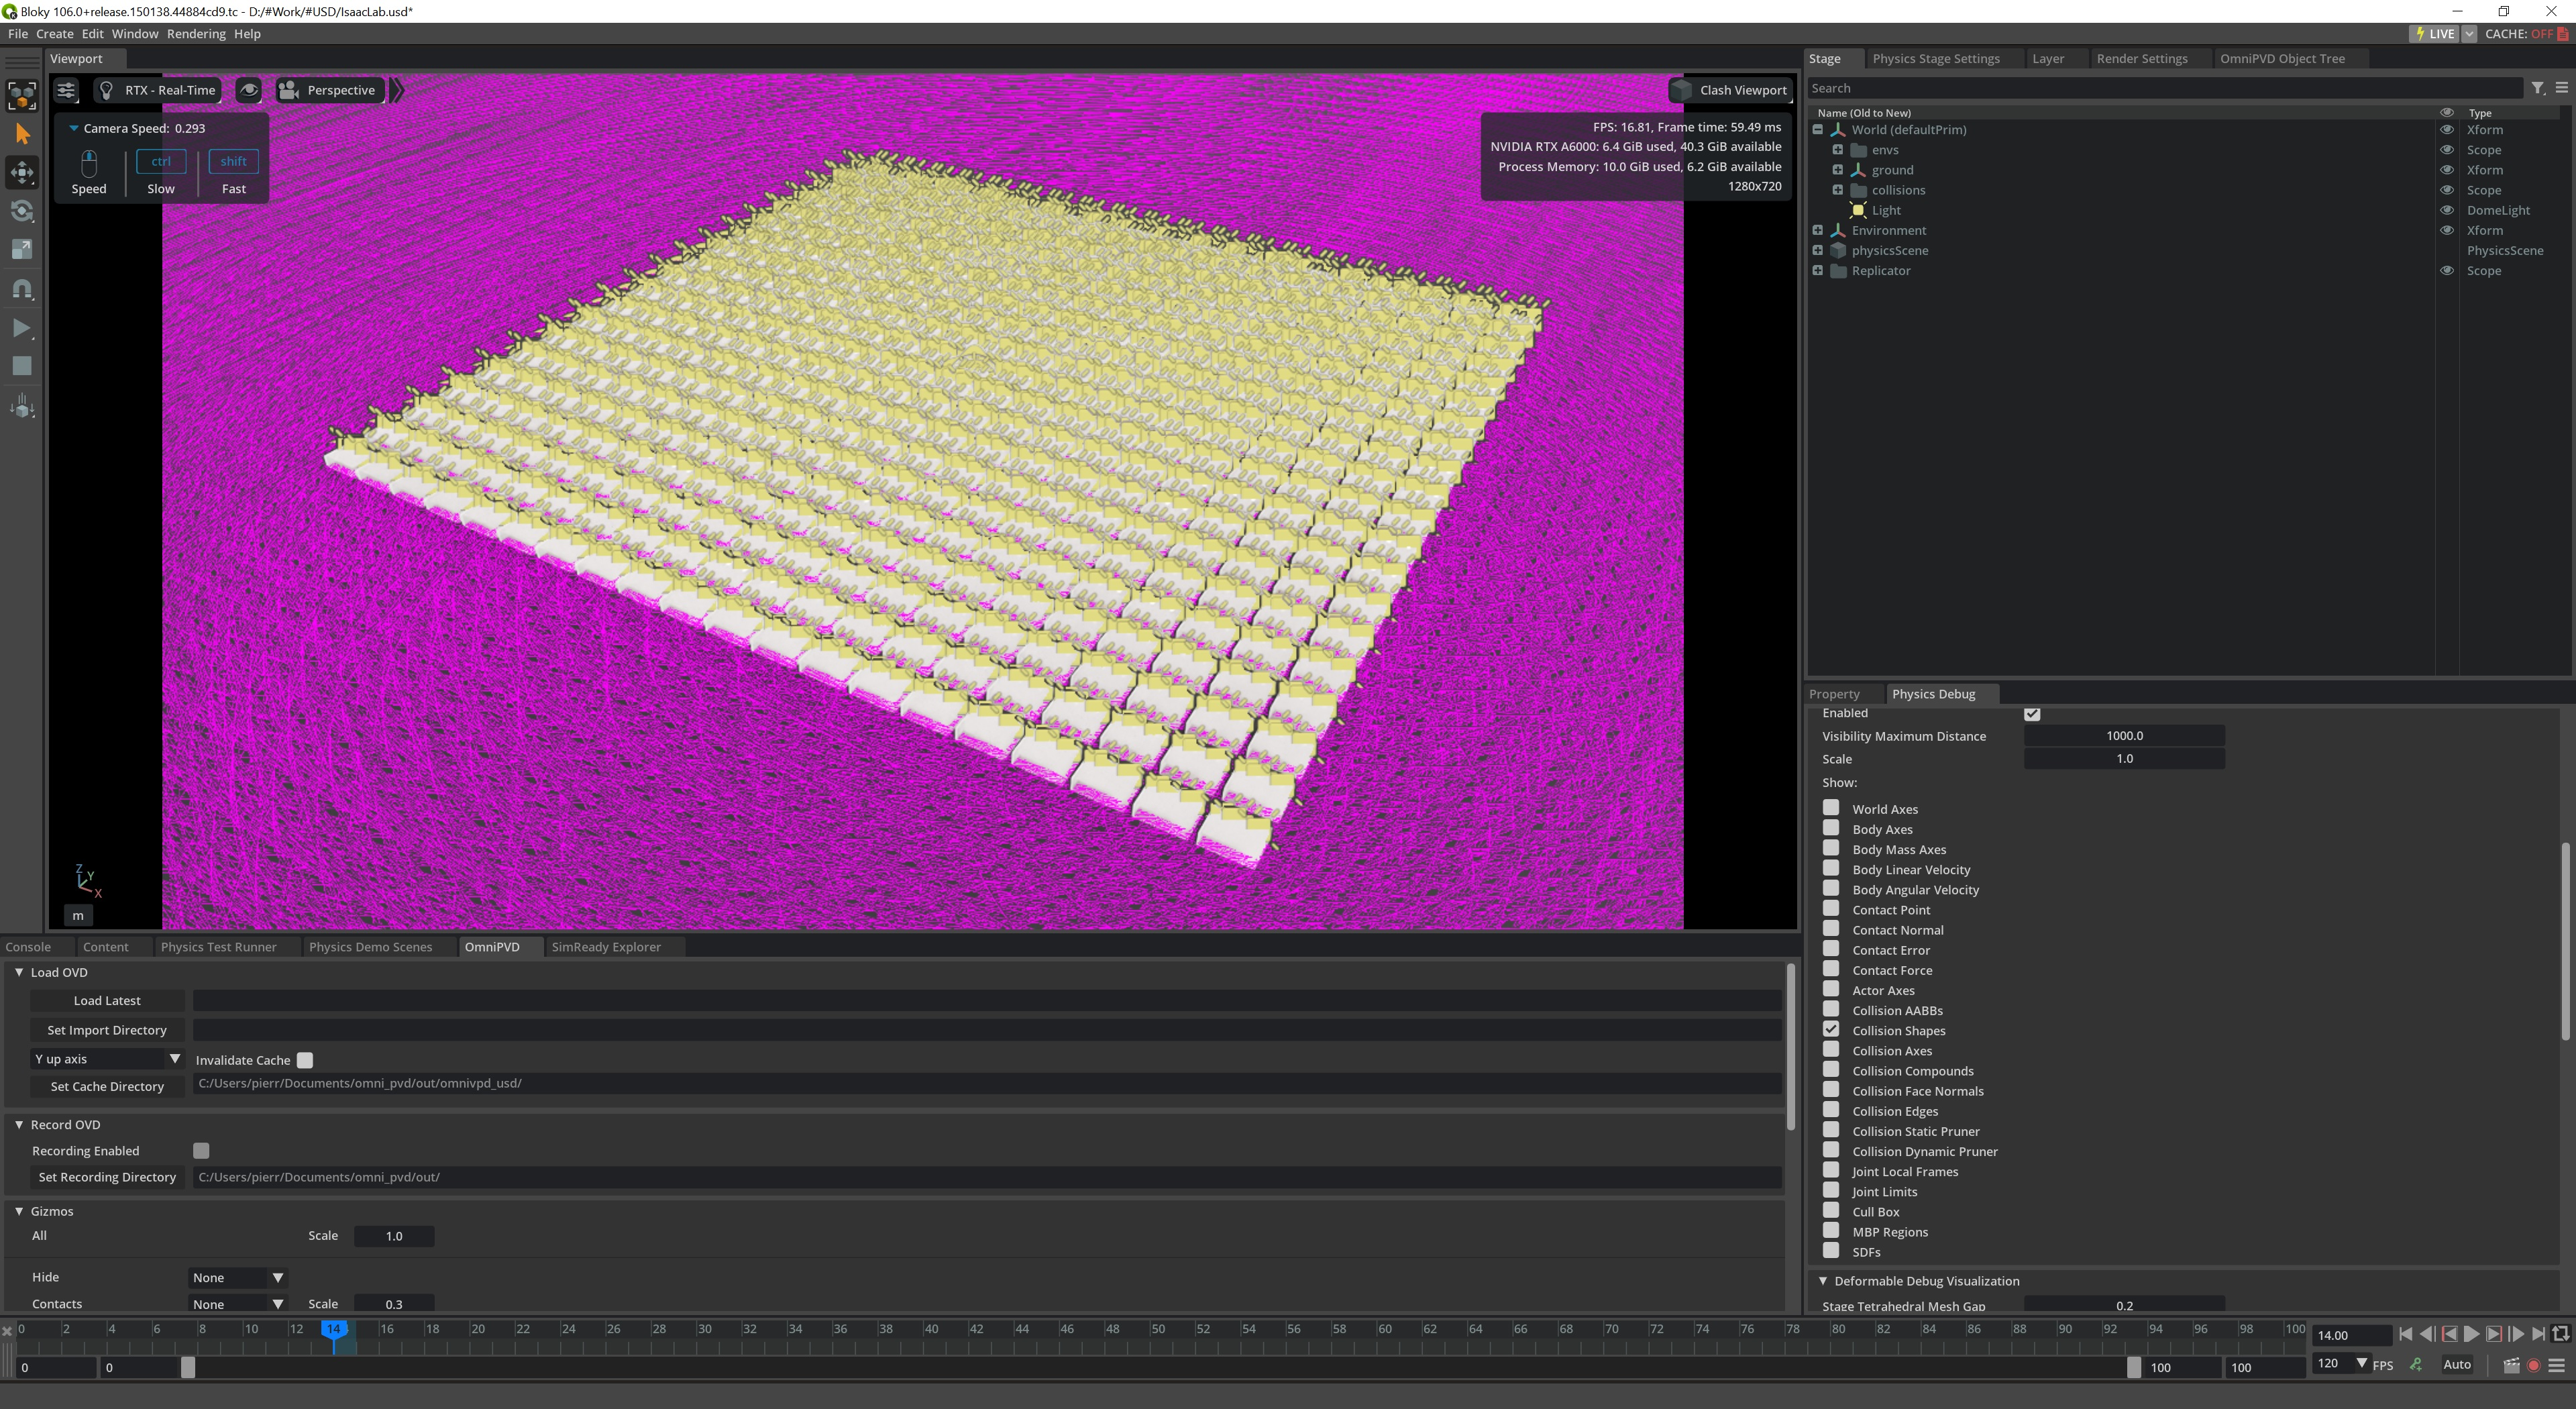
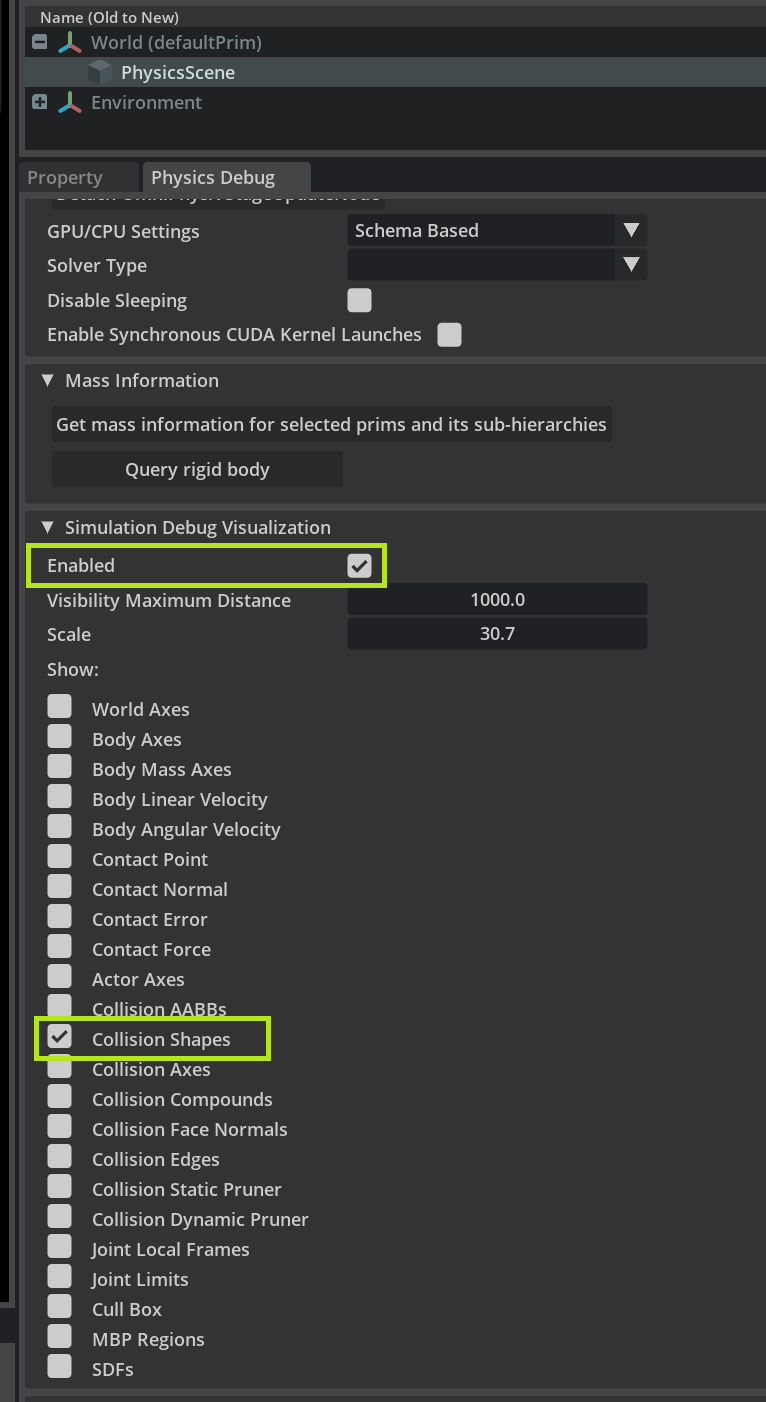
Use the PhysX debug visualization (as enabled in the screenshot below) to inspect the scene and visually confirm that everything looks fine. In the above screenshot, the visual hint that something is wrong is the unexpected sea of magenta debug lines all around the scene.
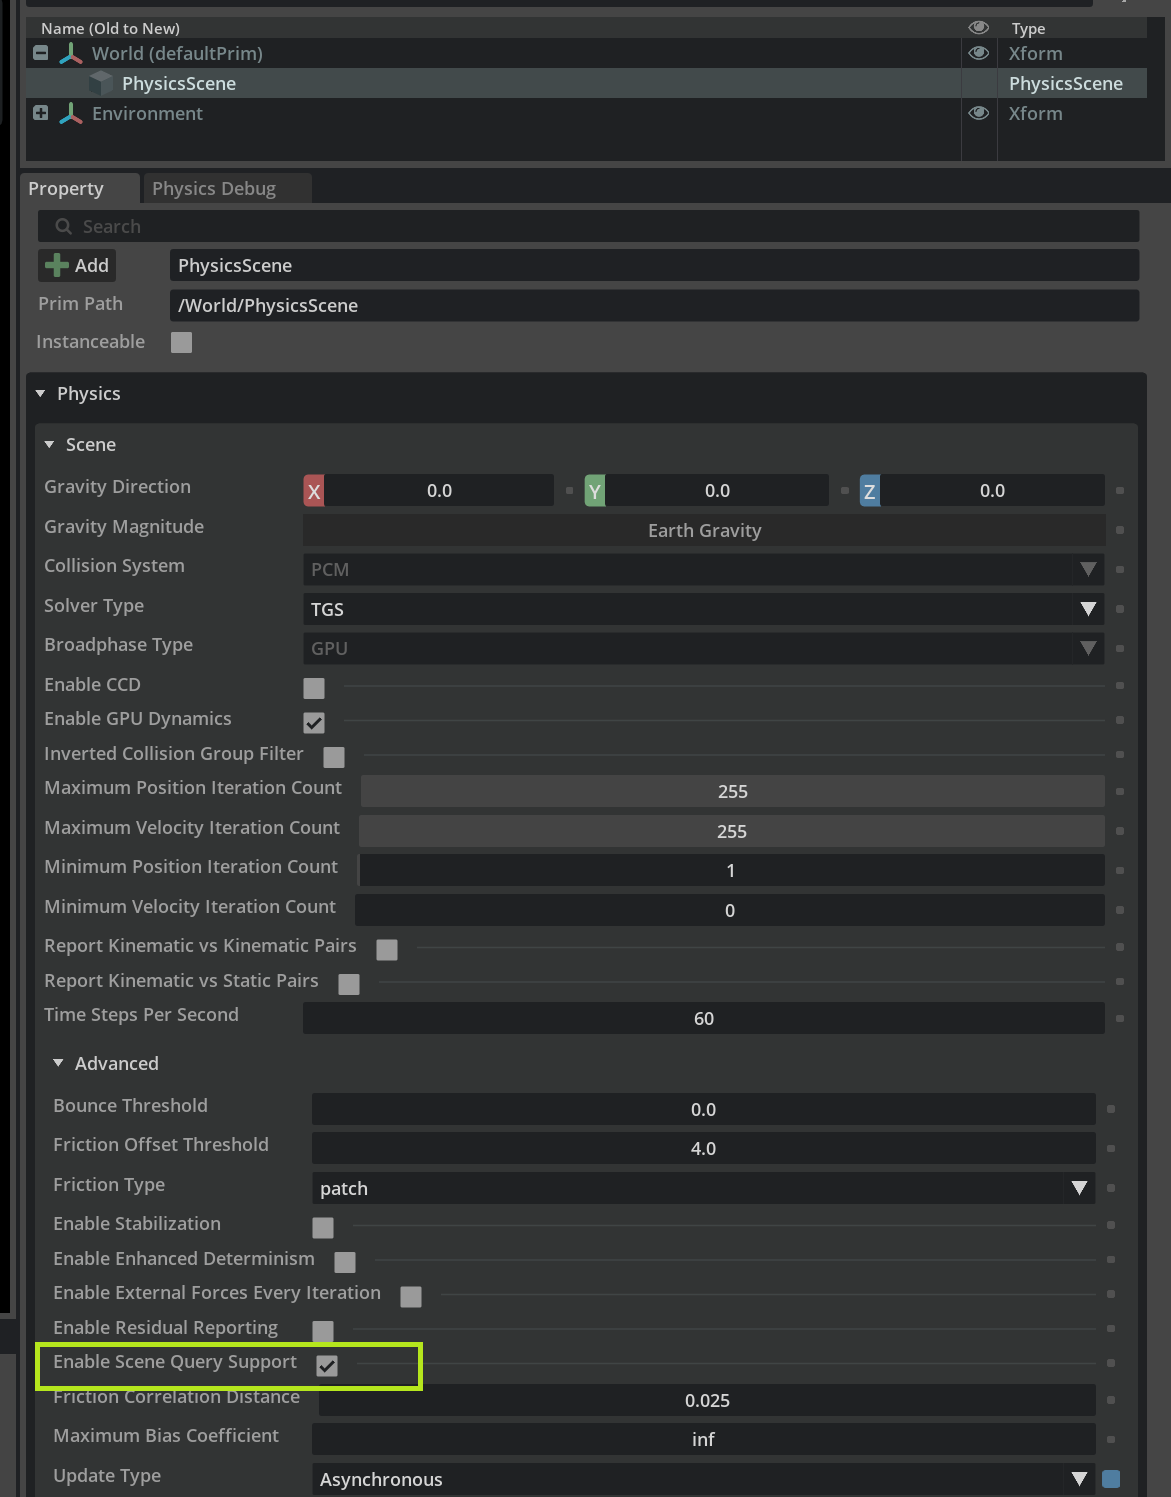
Disable Scene Query Support#
If you are not using scene queries, you may disable support for it to improve performance.
This can be changed in the Property panel of a PhysicsScene.
Multi-GPU Render and Simulation#
If your machine has multiple GPUs, setup the simulation and render to use two distinct GPUs.
Collision Geometry Choice#
The simpler the collision geometry, the faster the simulation. For example, an SDF mesh collider will be more expensive than a simple sphere.
Deformable or Particle Features#
Deformables and particles are considerably more expensive to simulate than rigid bodies. Instead of deformables, you may want to experiment with rigid bodies and compliant contacts, or rigid bodies connected with joints to approximate a deformable geometry.
Python Callbacks#
Users can implement per-physics-step or simulation-event callbacks in Python. It is good to be aware that this callback code can become a bottleneck.