NVCF Configuration for Azure Monitor#
Add Telemetry Endpoint#
Note
If you have an existing application insights and log analytics workspace, navigate to Overview, followed by JSON View to capture the connection string.
Azure Monitor Setup
Create a new Application Insights Instance
Go to Azure. Select
Monitor, followed byApplication Insights.
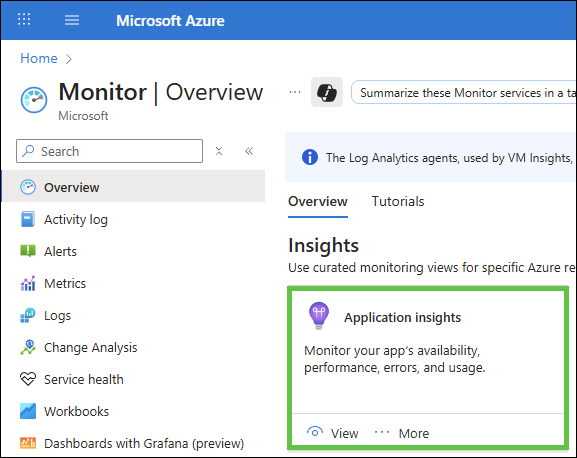
Under
Application Insights, selectView, followed by+ Create.Choose appropriate values for
Subscription,Resource Group, andLog Analytics Workspace
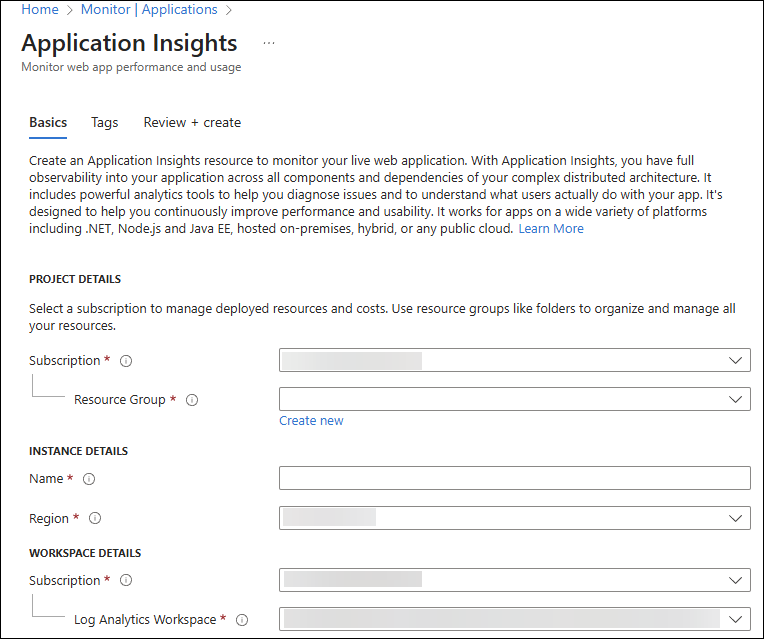
Select Review + create
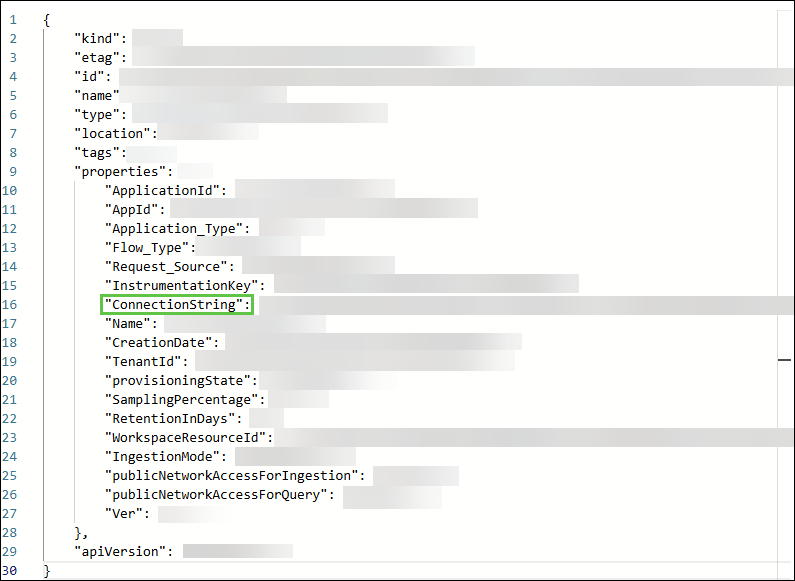
Navigate to Overview, followed by JSON View and then capture the ConnectionString Value
NVCF Create Telemetry Endpoint#
Documentation for creating a Telemetry Endpoint can be found here.
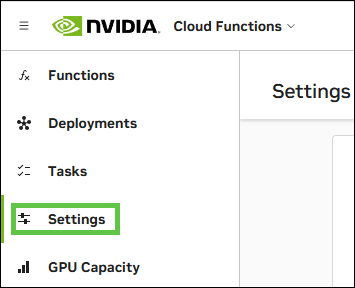
Via the UI, navigate to https://nvcf.ngc.nvidia.com/, followed by
Settings
Under
Telemetry Endpoints, select+ Add Endpoint

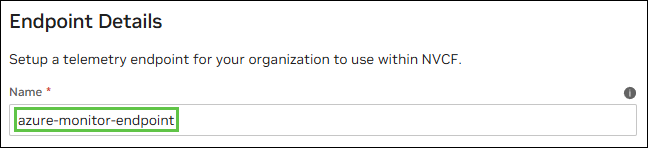
Provide an appropriate Name under Endpoint Details. We are using azure-monitor-endpoint
Select
Azure MonitorFrom the copied connection string value from Azure, paste the following values:
Endpoint (IngestionEndpoint) |
|
Instrumentation Key |
xxxxxxxx-xxxx-xxxx-xxxx-xxxxxxxxxxxx |
Live Endpoint |
|
Application ID |
xxxxxxxx-xxxx-xxxx-xxxx-xxxxxxxxxxxx |
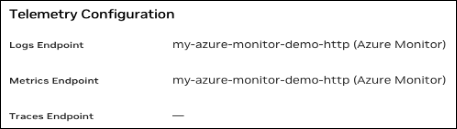
Select
Logs, followed byMetricsunder Telemetry TypeSelect
HTTPfor the communication protocol
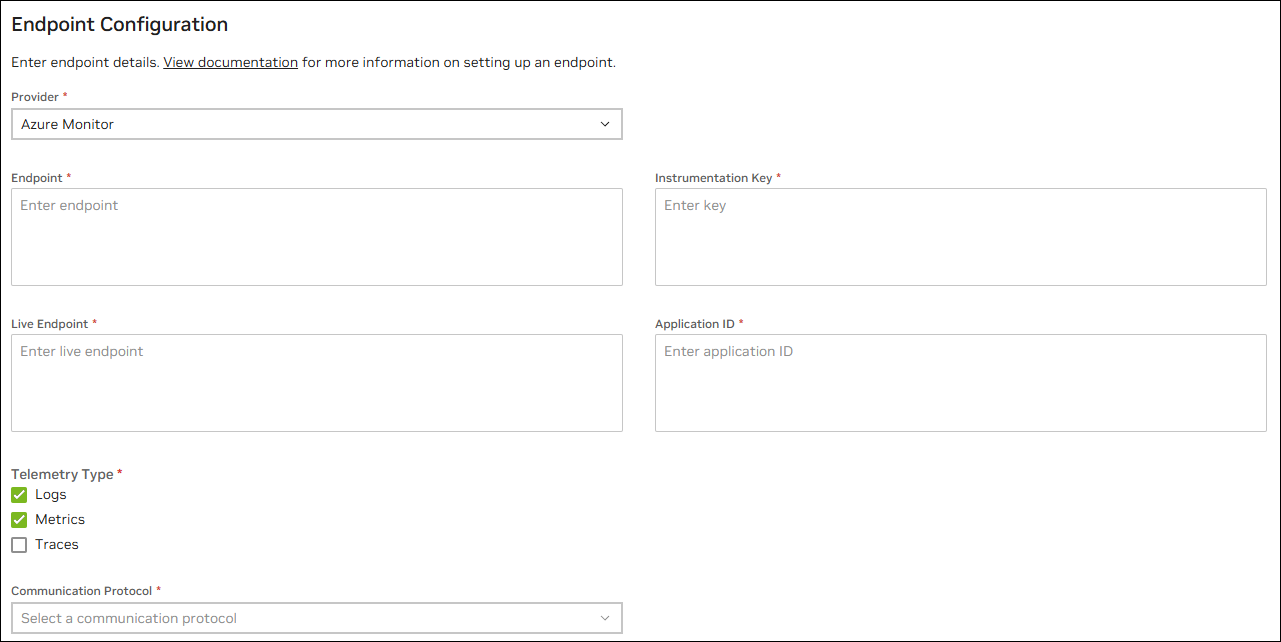
Select
Save ConfigurationVia the CLI, run the following command:
curl -s --location --request POST
'https://api.ngc.nvidia.com/v2/nvcf/telemetries' \
--header 'Content-Type: application/json' \
--header 'Authorization: Bearer '$NVCF_TOKEN \
--data '{
    "endpoint": "YOUR_AZURE_MONITOR_ENDPOINT",
    "protocol": "HTTP",
    "provider": "AZURE_MONITOR",
    "types": [
        "LOGS",
        "METRICS"
    ],
    "secret": {
        "name": "YOUR_NVCF_TELEMETRY_NAME",
        "value": {
            "instrumentationKey": "YOUR_INSTRUMENTATION_KEY",
            "liveEndpoint": "YOUR_LIVE_ENDPOINT",
            "applicationId": "YOUR_APPLICATION_ID"
        }
    }
}'
Get Telemetry ID#
Once you have created the telemetry endpoint, we need to capture the telemetryId for the created Azure Monitor telemetry on NVCF. This is required to create the function via the CLI/Script.
Note
This step is not required for creating the function via the NVCF UI.
echo NVCF_TOKEN="nvapi-xxxxxxxxxxxxxxxxxxxxxx"
Run the following command to get the telemetryId of the created Azure Monitor endpoint:
curl -s --location --request GET
'https://api.ngc.nvidia.com/v2/nvcf/telemetries' \
 --header 'Content-Type: application/json' \
 --header 'Authorization: Bearer '$NVCF_TOKEN'' | jq
Copy the telemetryId field for the created azure-monitor-endpoint:
"telemetryId": "xxxxxxxx-xxxx-xxxx-xxxx-xxxxxxxxxxxx",
"name": "azure-monitor-endpoint",
"endpoint": xxx
.
.
"createdAt":xxx
Store the value in a variable called Telemetry_ID:
export TELEMETRY_ID="xxxxxxxx-xxxx-xxxx-xxxx-xxxxxxxxxxxx"
Environment Variables#
The BYOO implementation uses environment variables to control Vector behavior and configuration. These variables are set during NVCF function deployment and control how the container processes logs.
Environment Variable |
Possible Values |
Function |
|---|---|---|
VECTOR_OTEL_ACTIVE |
TRUE ; FALSE / Not set |
When TRUE: Container uses Vector for log processing and forwarding to NVCF collector. When FALSE or unset: Container bypasses Vector and runs Kit application directly via /entrypoint.sh |
VECTOR_CONF_B64 |
Base64 encoded string |
Provides custom Vector configuration via base64-encoded string |
If you provide your
VECTOR_CONF_B64value the entrypoint decodes and uses your custom Vector configuration.When not provided, it uses the default configuration from vector.toml which is copied to the path
/opt/vector/static_config.tomlinside the container.
To base64 encode, use the following command:
base64 -w 0 vector.toml
Container to Function Flow#
Via the CLI:
curl -s -v --location --request POST 'https://api.ngc.nvidia.com/v2/nvcf/functions' \
--header 'Content-Type: application/json' \
--header 'Authorization: Bearer '$NVCF_TOKEN'' \
--data '{
"name": "'${STREAMING_FUNCTION_NAME:-usd-composer}'",
"inferenceUrl": "'${STREAMING_START_ENDPOINT:-/sign_in}'",
"inferencePort": '${STREAMING_SERVER_PORT:-49100}',
"health": {
"protocol": "HTTP",
"uri": "/v1/streaming/ready",
"port": '${CONTROL_SERVER_PORT:-8111}',
"timeout": "PT10S",
"expectedStatusCode": 200
},
"containerImage": "'$STREAMING_CONTAINER_IMAGE'",
"apiBodyFormat": "CUSTOM",
"description": "'${STREAMING_FUNCTION_NAME:-usd-composer}'",
"functionType": "STREAMING",
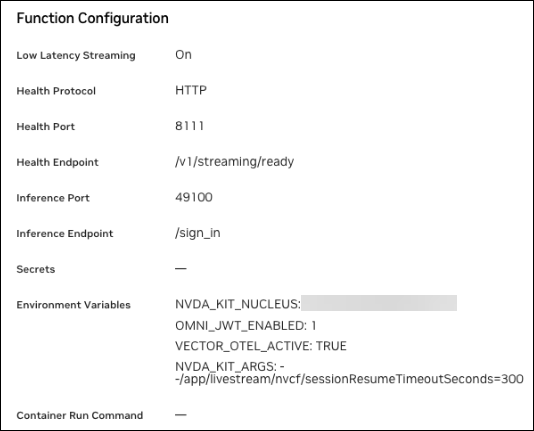
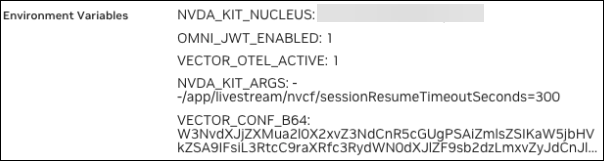
"containerEnvironment": [
{"key": "NVDA_KIT_NUCLEUS", "value": "'$NUCLEUS_SERVER'"},
{"key": "OMNI_JWT_ENABLED", "value": "1"},
{"key": "VECTOR_OTEL_ACTIVE", "value": "TRUE"},
{"key": "NVDA_KIT_ARGS", "value":
"--/app/livestream/nvcf/sessionResumeTimeoutSeconds=300"}
],
“telemetries”: {
“logsTelemetryId”: “'$TELEMETRY_ID'”,
"metricsTelemetryId": "'$TELEMETRY_ID'"
}
Via the UI:
Or if you provide custom B64:
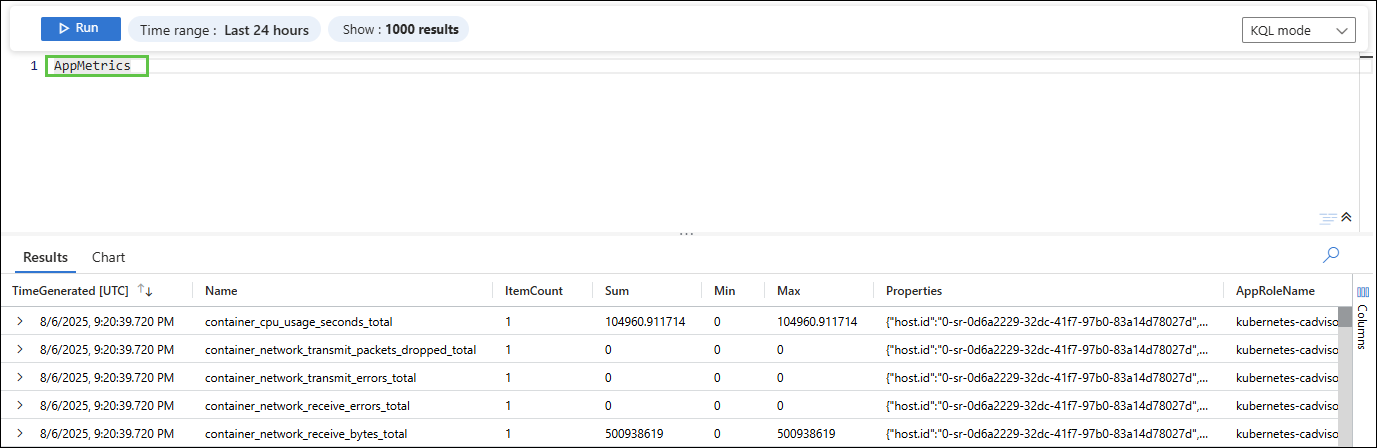
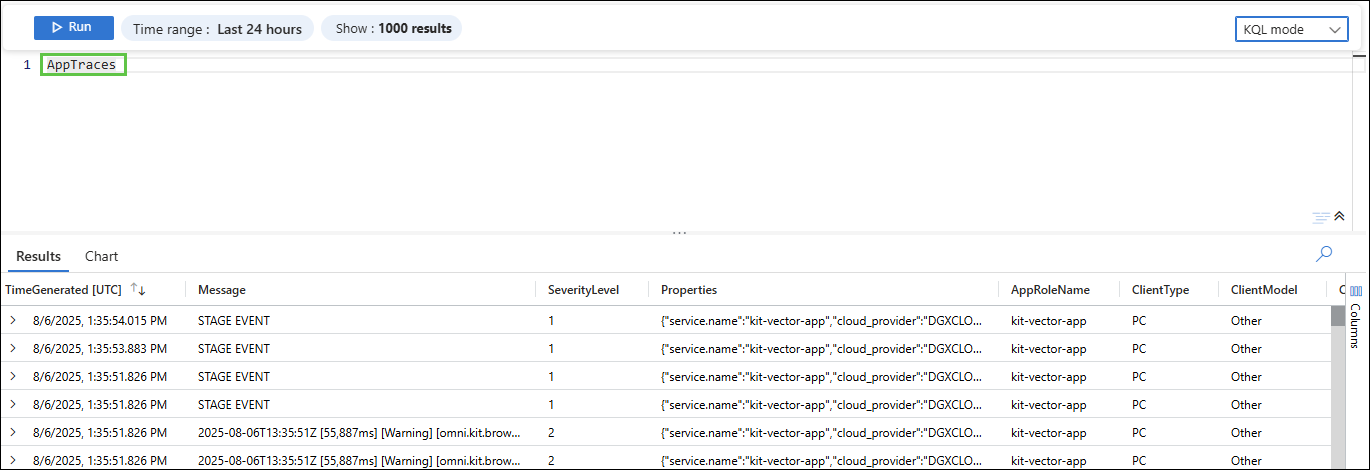
Confirm Telemetry on Azure Monitor#
Sample KQL query:
For Logs:
AppTraces
| where Properties.function_id == "xxxxxxxxxxxx"
For Metrics:
AppMetrics
| where Properties.function_id == "xxxxxxxxxxxx"